Disclaimer: My attempt here is to provide a conceptual understanding of derivatives. It is not comprehensive and is instead meant to provide a “foot in the door” amount of knowledge of the concepts.
Introduction
Derivatives have, at first glance, a scary name. They look like this terrifying beast but in reality are one of the most simple ideas in mathematics that you probably use on a daily basis. Before we get into it, lets do what Socrates would do and first define the terms.
Terms
Derivative
From etymonline.com:
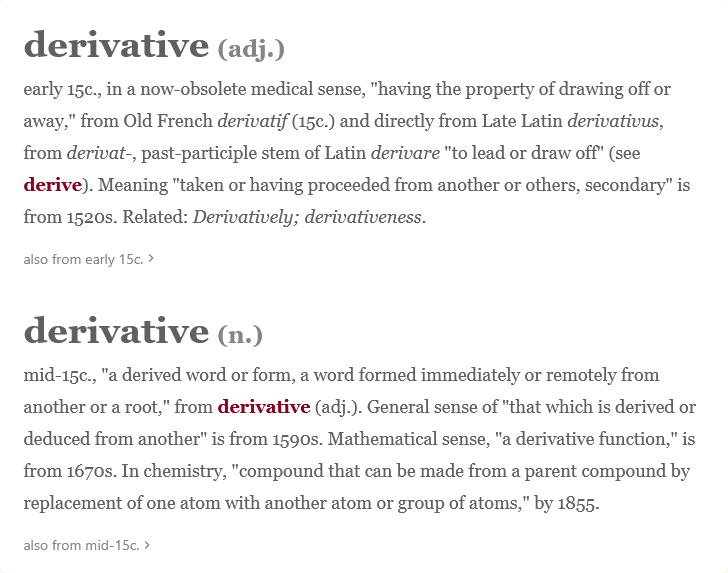
So a derivative is something that was derived from another. Meaning something was created from something else through a process of steps. For example, we derive the meaning of a word we don’t know using context clues in a text
Differentiate
This term actually has its origins in math vocabulary. The technical definition is, again using etymonline.com:
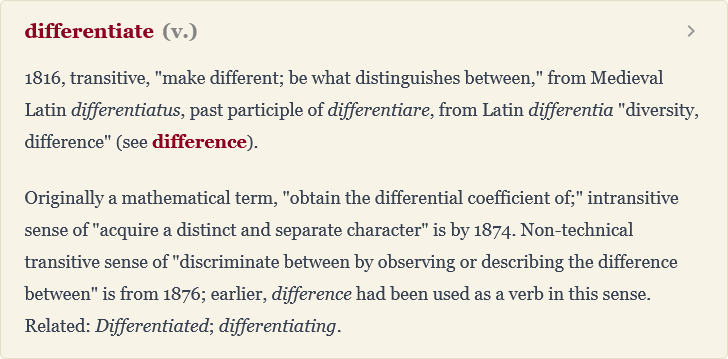
So, it literally means to take the difference of something. We will get to this later.
Ground Work
Before we jump straight into the ocean, we want to make sure we have all our equipment. Much of this is elementary algebra but making sure we have all our bases covered is crucial for complete understanding.
Rates
Rates are the MOST FUNDAMENTAL thing to understand with derivatives because, spoiler alert, derivatives are just rates.
A rate is something that changes with another. This is best explained with an example. When we drive on the road the speed-limit sign prompts us to drive at a specific rate like 60 miles per hour. We are driving 60 miles every hour. This means the number of miles changes with the number of hours. In math, we say that we are driving 60 miles with respect to one hour. So you can think of “with respect” to be the same thing as the “per” in miles per hour.
Rates do not need to be exclusive to time however. Another driving metaphor to explain this is fuel efficiency. We describe how far our car can drive before needing to stop by the gas station in miles per gallon. Using math lingo, that’s miles with respect to one gallon.
You may notice that in both scenarios we have miles with respect to something. Both of these are special kinds of rates that have specific names.
- Miles per hour is a rate that describes a change in position over time. This is called speed. A speed is just a rate.
- Miles per gallon describes efficiency. Gas isn’t cheap, so we want to make sure we get the most distance for the least amount of money. We are trying to get the biggest output with the smallest input.
Visualizing
The cool thing about math is that almost all of it can be described visually. If you took math in sixth grade you may be familiar with something called a linear graph. A linear graph is just a graph with a straight line. Something like this: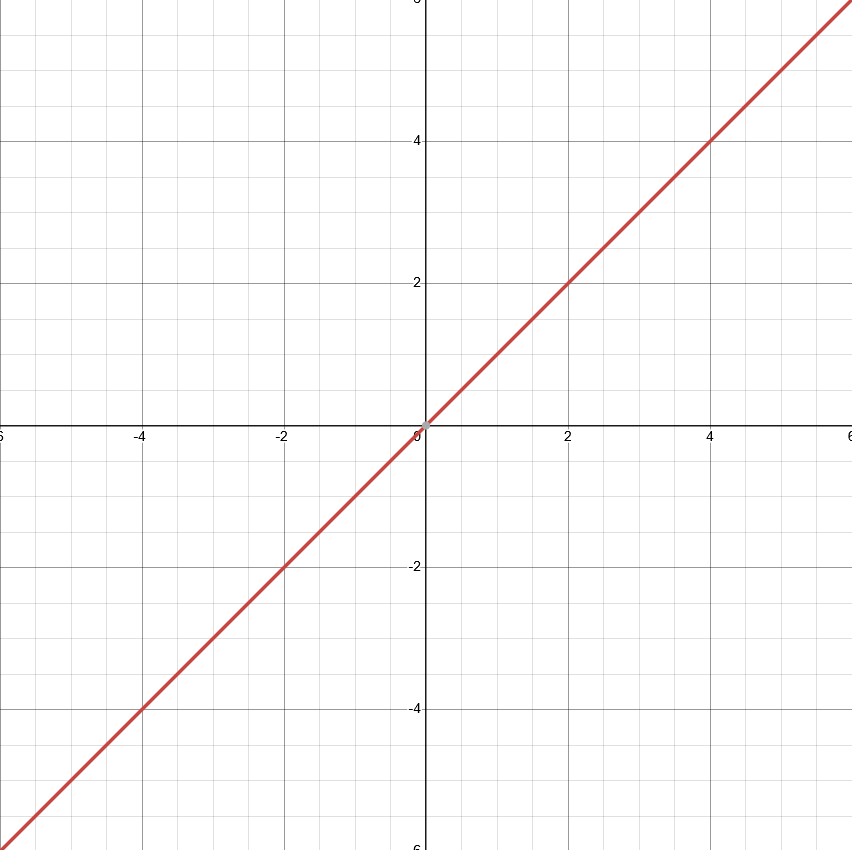
In the language of numbers, we describe this as:
where
Using that equation, the graph above looks like
therefore:
Lets stop here for a moment and think a little deeper about what has just been described. The y-value is equal to the x-value. We can use this kind of graph to visually describe rates.
Lets go back to our speed rate. We know speed is a change in position over time. Let’s say the x-axis is our time-value (in hours), and the y-axis is our position (in miles). If we look at the graph we can see that for every change of a value of 1, there is a change in value of 1 for the y-axis. This means that we are moving at one mile per hour, or one mile with respect to one hour. If we wanted to describe it mathematically we would do it like so:
If you aren’t already aware, we use the Greek capital letter
Wait a second… that’s the definition of slope! Our value for m in the linear equation is 1, which means:
The change in
Principles of the Derivative
With the background work out of the way it’s time to move on to the meat. As stated in the overview, Derivatives seem scary. I promise you they are not. As you read you’ll see why. :)
The Idea
As seen in the previous section the rate of change of a linear graph is the slope. The thing about slope however is that it is constant - for a linear graph the slope does not change. Theoretically, this isn’t a problem. It is a problem in reality. Systems aren’t perfect, we aren’t driving perfectly at 60 miles per hour, or have a perfect fuel efficiency of 25 miles per gallon. There is variation. For example, here is the fuel efficiency of a 2009 Toyota Corolla at different speeds. 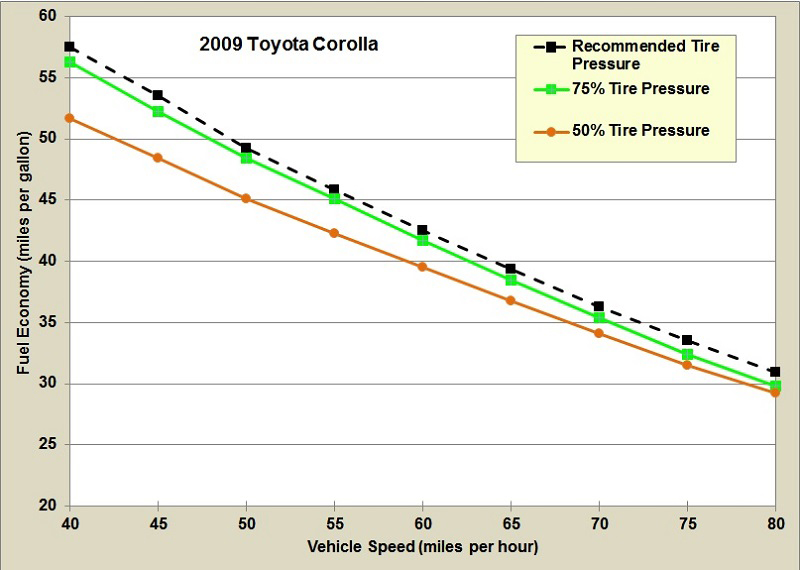
It may look relatively linear but there is a curve. So what is the slope? Can we even calculate the slope? The answer is yes - sort of. You see, there isn’t just one slope there’s a lot and the value of the slope depends on where you are. This shows that the slope (rate) is dependent upon where you are measuring it.
Baby-Steps
Let’s move to a simpler graph, an exponential. 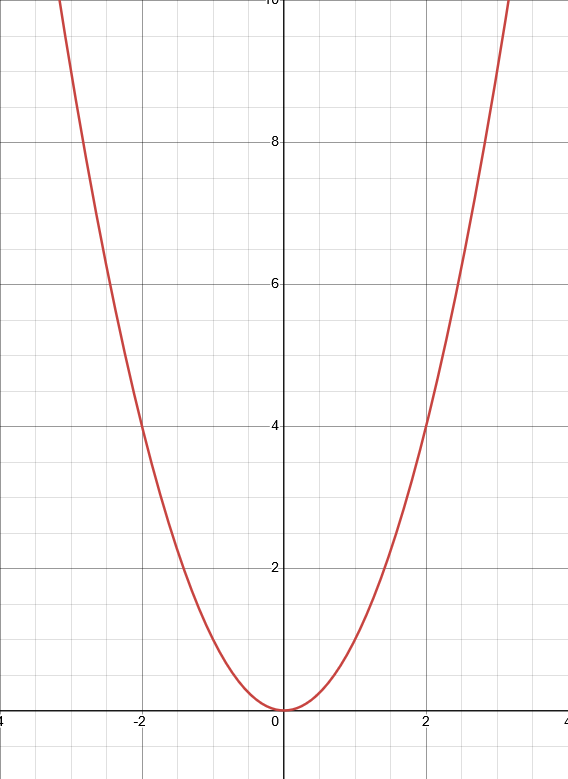
This graph is described with:
It’s obvious here that our slope, or the rate is changing. We can’t perfectly describe the whole equation with a straight line. We can however approximate a specific part. Let’s overlay our exponential graph with our linear graph where 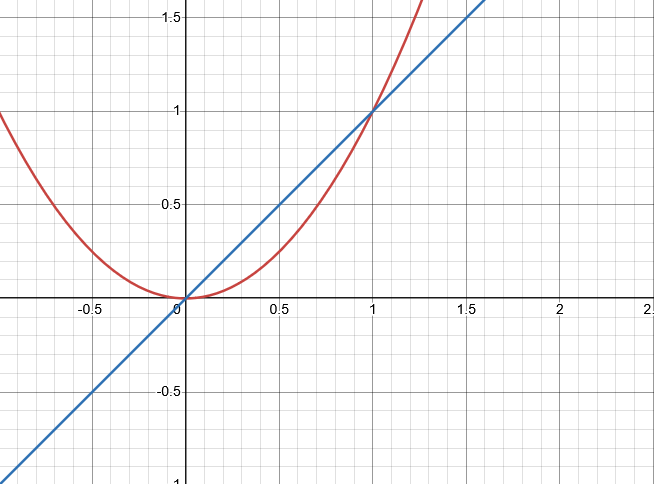
Notice it intersects the graph at 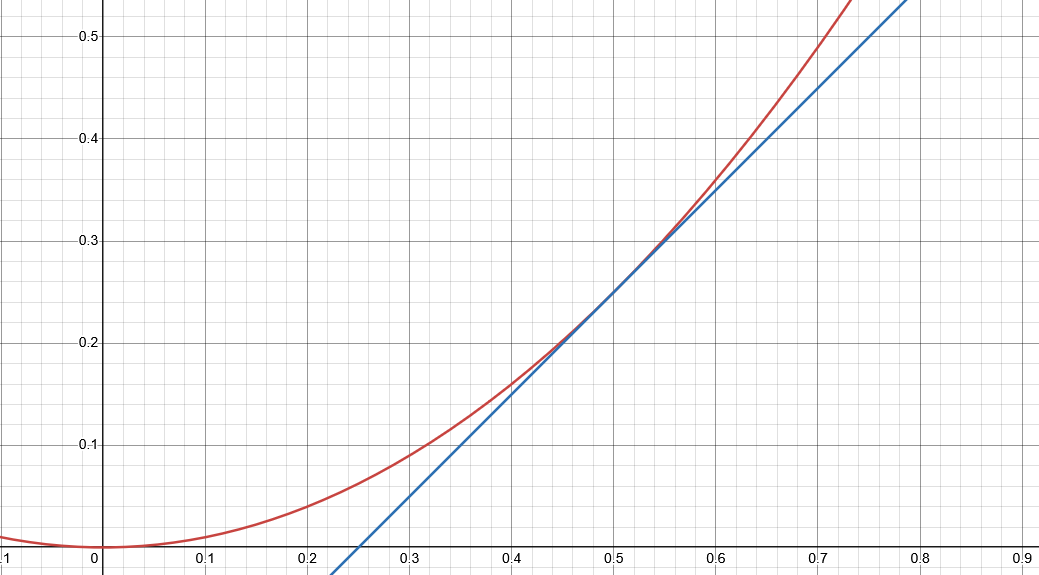
This is called a Tangent Line. It intersects the graph only at one point. If you notice, this is the slope at that point in the same way that the pitch of your car describes where you are on the hill.
More Car Analogies
As you are rolling up that hill, the pitch of your car (imagine the line) shows an incline, describing a positive slope meaning you are increasing in elevation over time. When you reach the top, for a brief moment you are no longer increasing or decreasing in elevation which means the rate at that point is 0. When you begin to roll down hill the pitch of your car describes a negative slope where you are decreasing in elevation over time.
Every place you measure the pitch of your car on that hill describes the slope at that point. It is describing what we call the instantaneous rate of change at that point.
The Culmination
Up to this point we have been heating the metal and are just about to strike with the hammer. Let’s quickly reiterate (I apologize if this is repetitive but if you are like me repetition is the bread and butter of retention).
- A derivative of something is an original thing that has a series of steps acted upon it to produce a new thing
- Rates are changes of one thing with respect to another thing
- When we have varying changes in rates we can describe the instantaneous rate of change using a tangent line.
I think we have enough here to fully develop the idea of the derivative. Here it is:
A derivative is a new equation derived from an original equation where the y-values of the new equation plot the instantaneous rate of change (slope) for every value of the original equation.
Let that sink in. Re-read it. Take a deep breath. What the hell does that mean?
Remember the tangent line on that exponential equation that described the slope of that specific point. Imagine us doing that for the infinitely many points along that equation, taking the value of the slope of that tangent line, such that we can plot those and have a new equation that describes the rate of change of the exponential function!
Finishing Up
Calculus, and mathematics in general, is an incredibly deep subject. It goes infinitely deep and infinitely wide. There is a lot that I did not discuss here. I hope to write a more technical write up of derivatives but my purpose of writing this was to provide a non-technical introduction showing that mathematics is incredibly conceptual and is not just a bunch of symbols.